Build the annual operating budget with the business units, covering revenue, costs, headcount and capex, so management has a plan to measure against.
With Seizmic
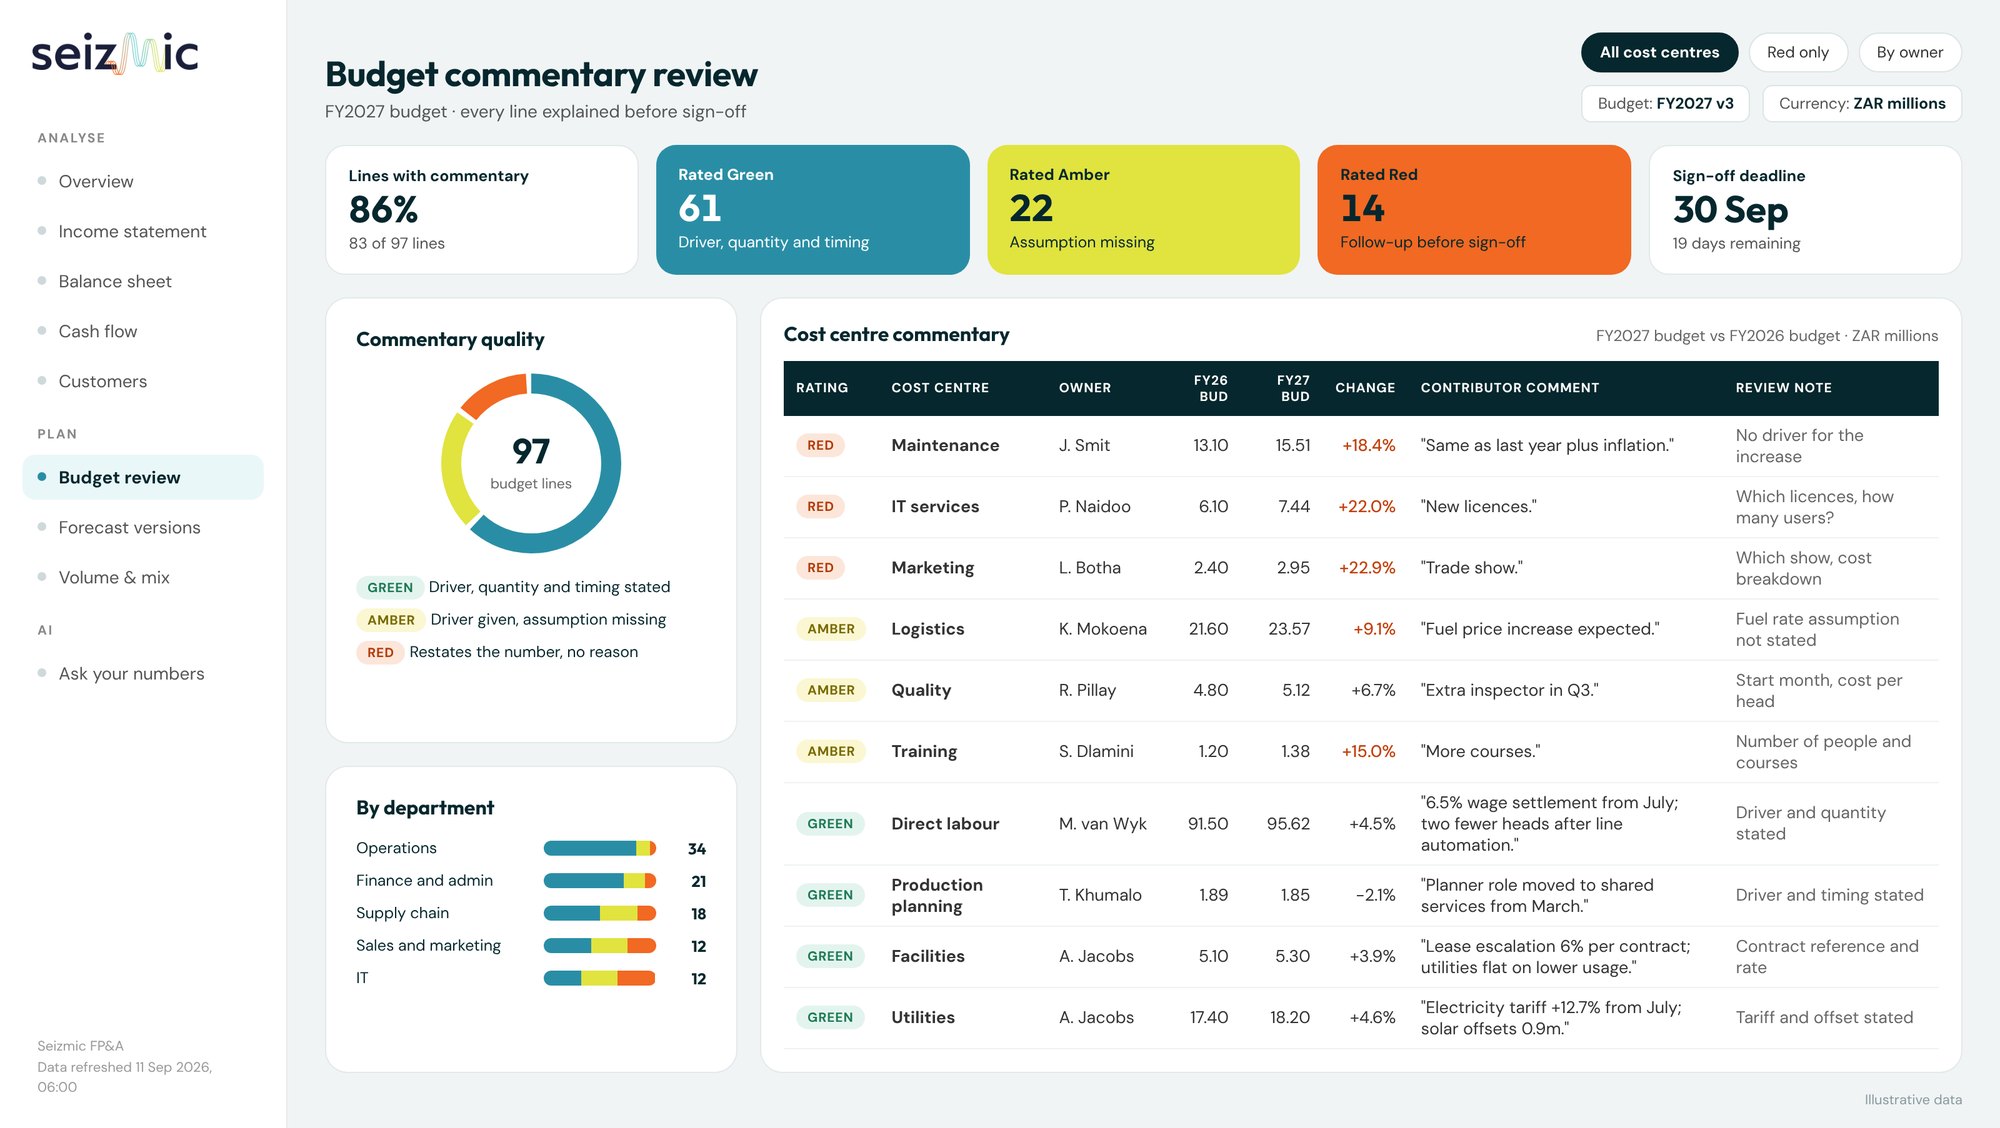
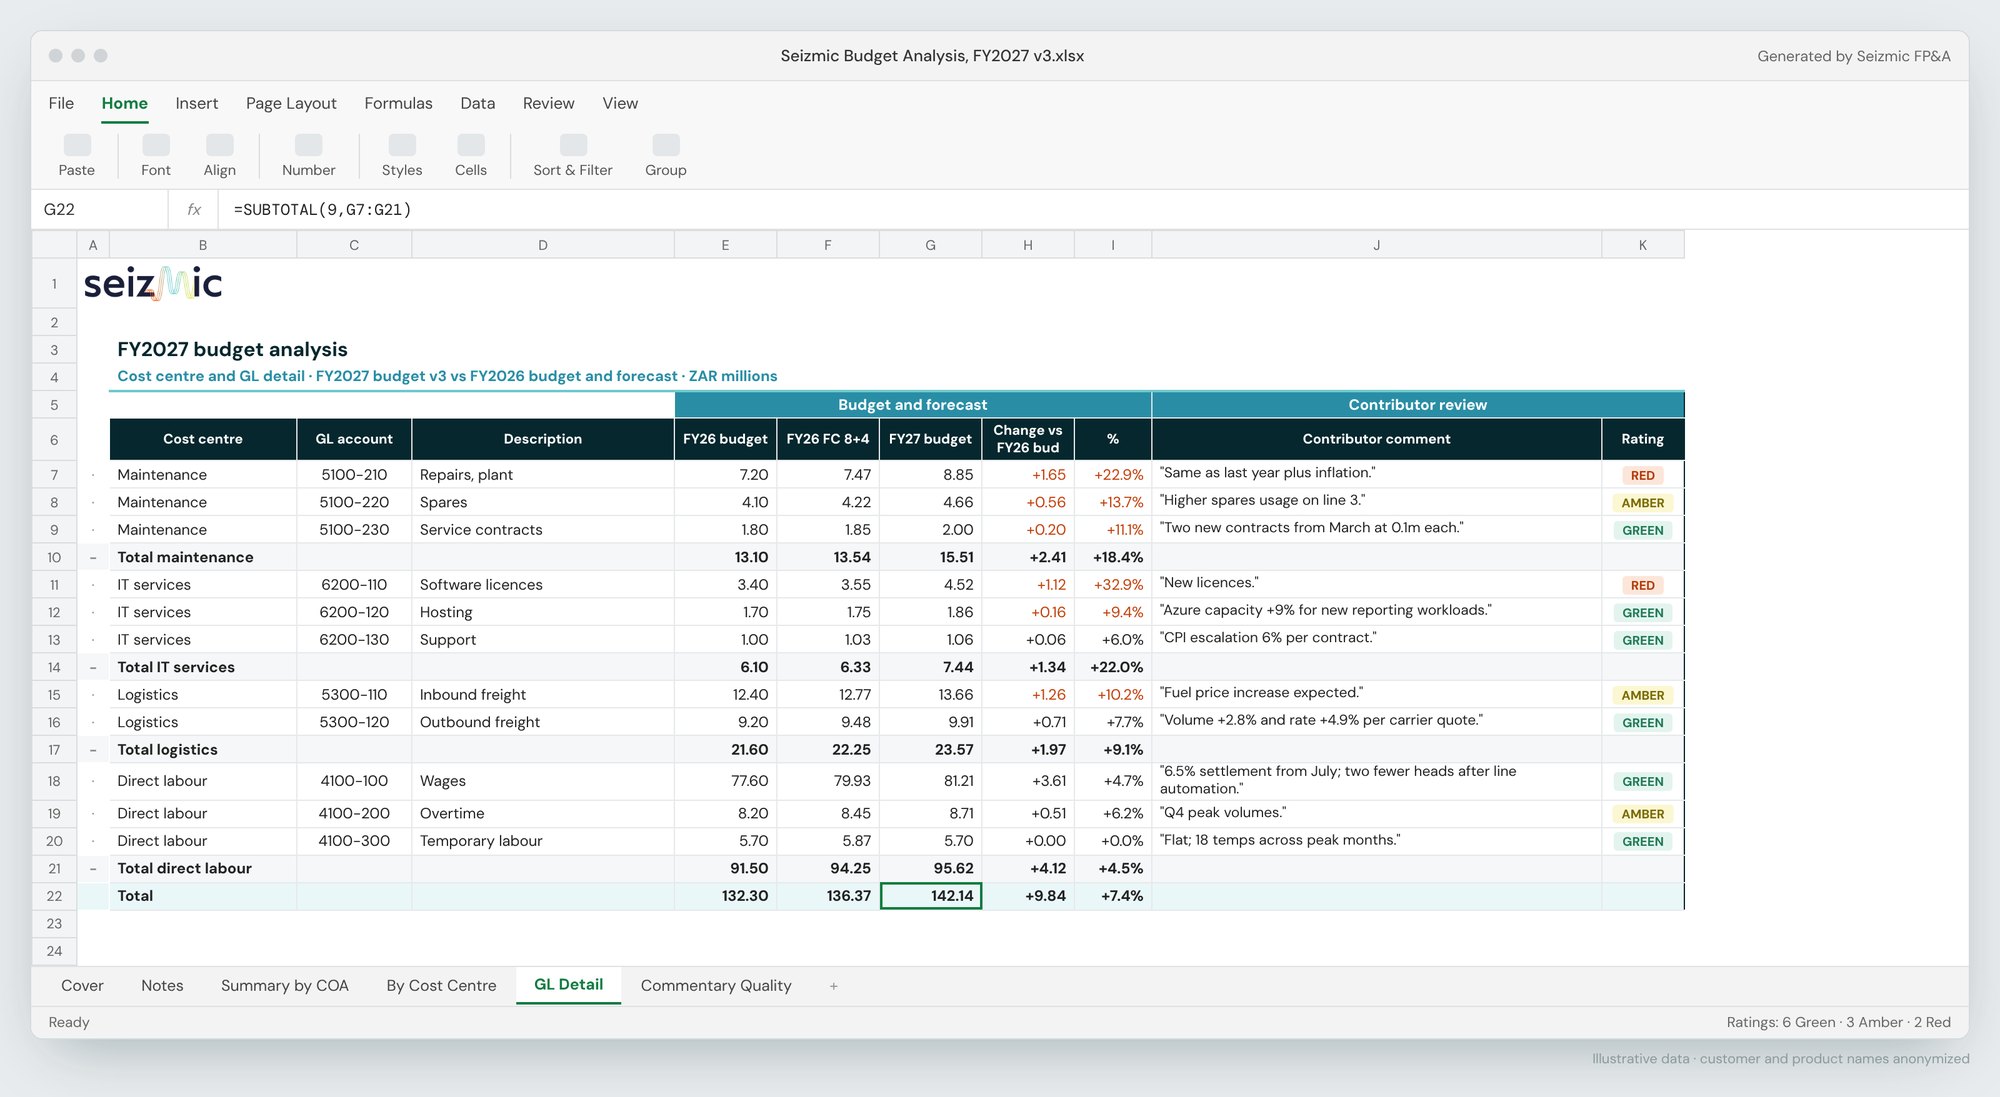
Budgets by business unit, cost center and GL account, collected in one place and rated for commentary quality before sign-off.
Contributors budget by business unit, cost center, GL, customer and product
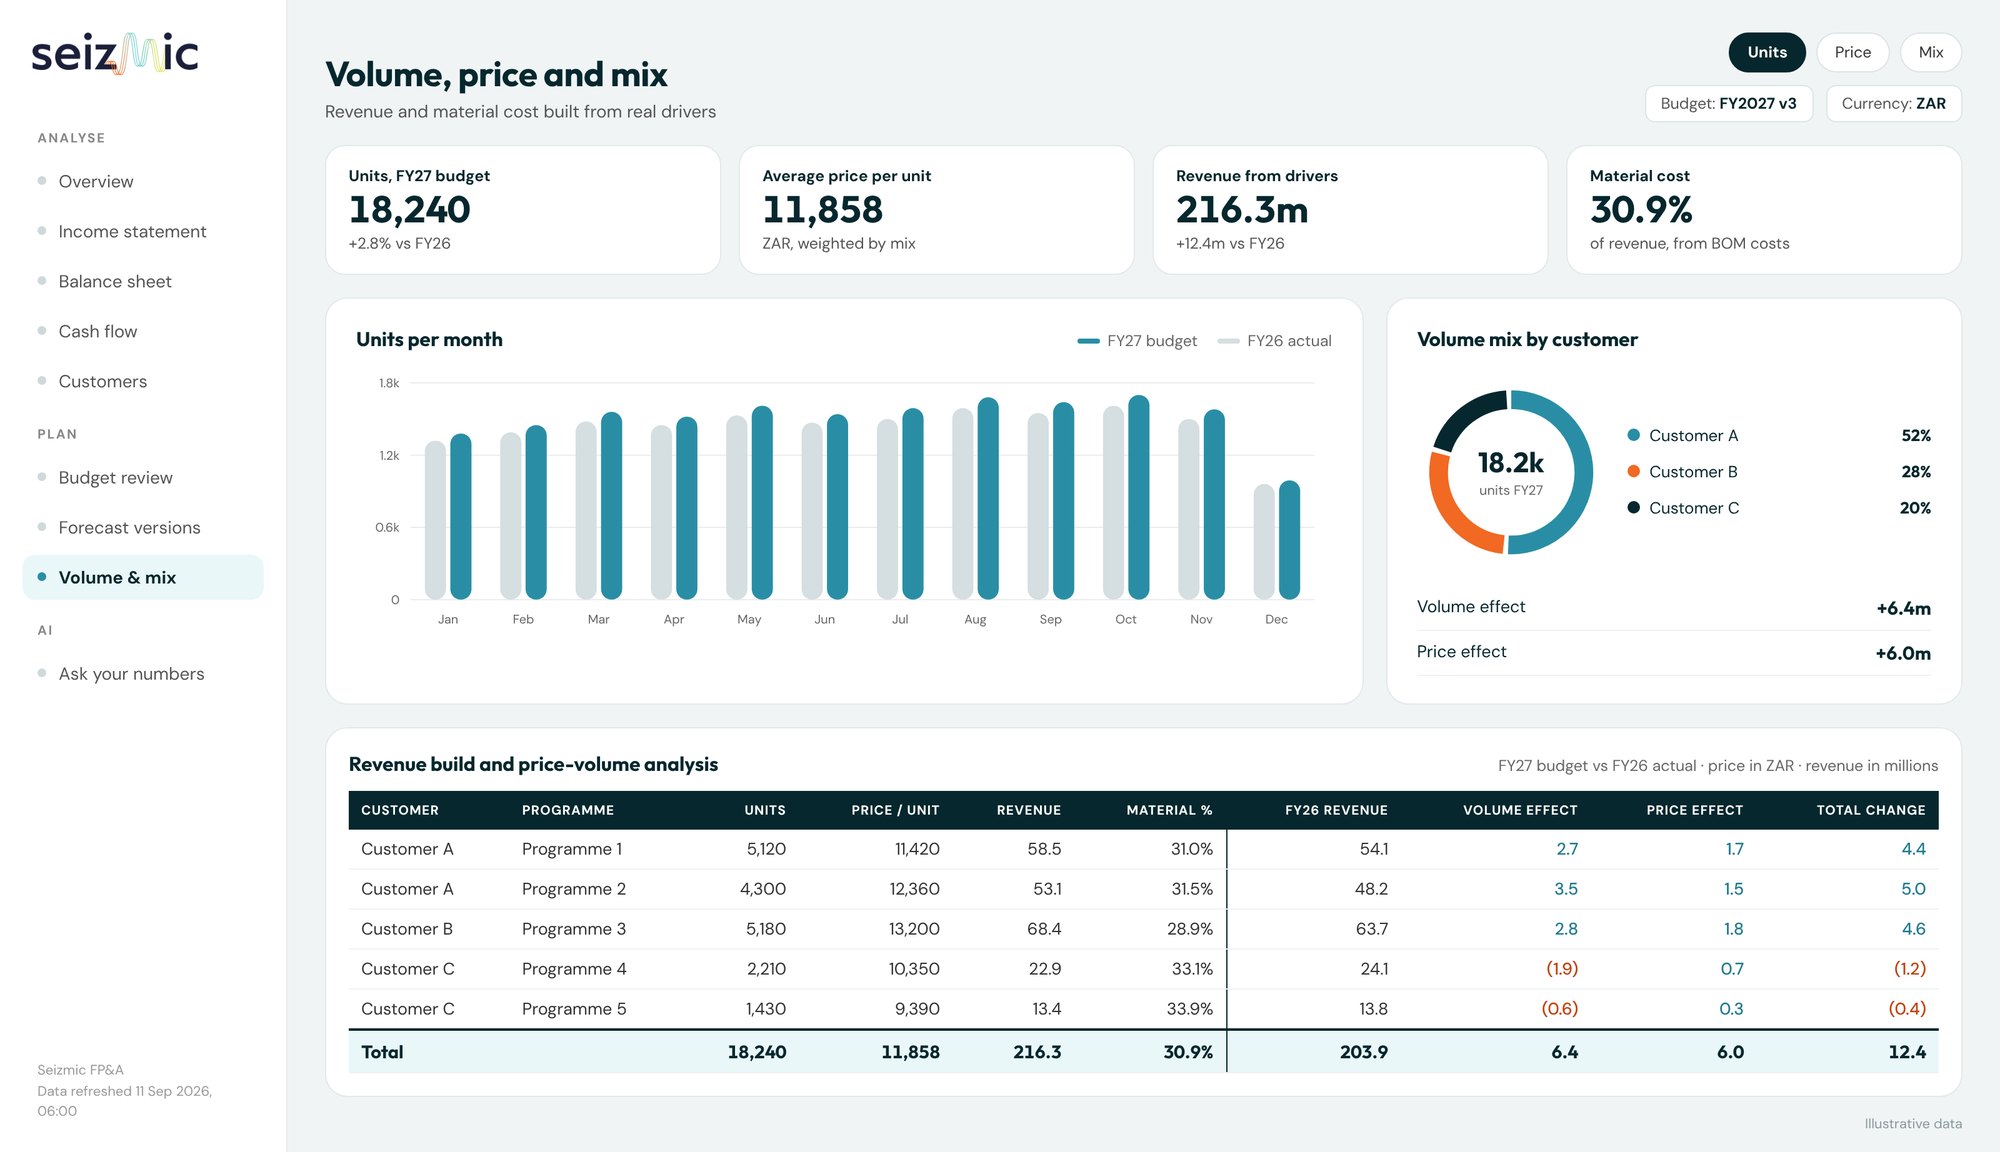
Revenue built from volume and price drivers, not typed-in totals
Every line carries the owner's commentary, rated so finance knows which lines to challenge
Prior year budget, actuals and forecast in the same view
[Confirm headcount and capex planning coverage.]
Reforecast during the year, as a rolling forecast or as versions like 3+9 and 7+5, from actuals to date and current assumptions, to project where the year will land.
With Seizmic
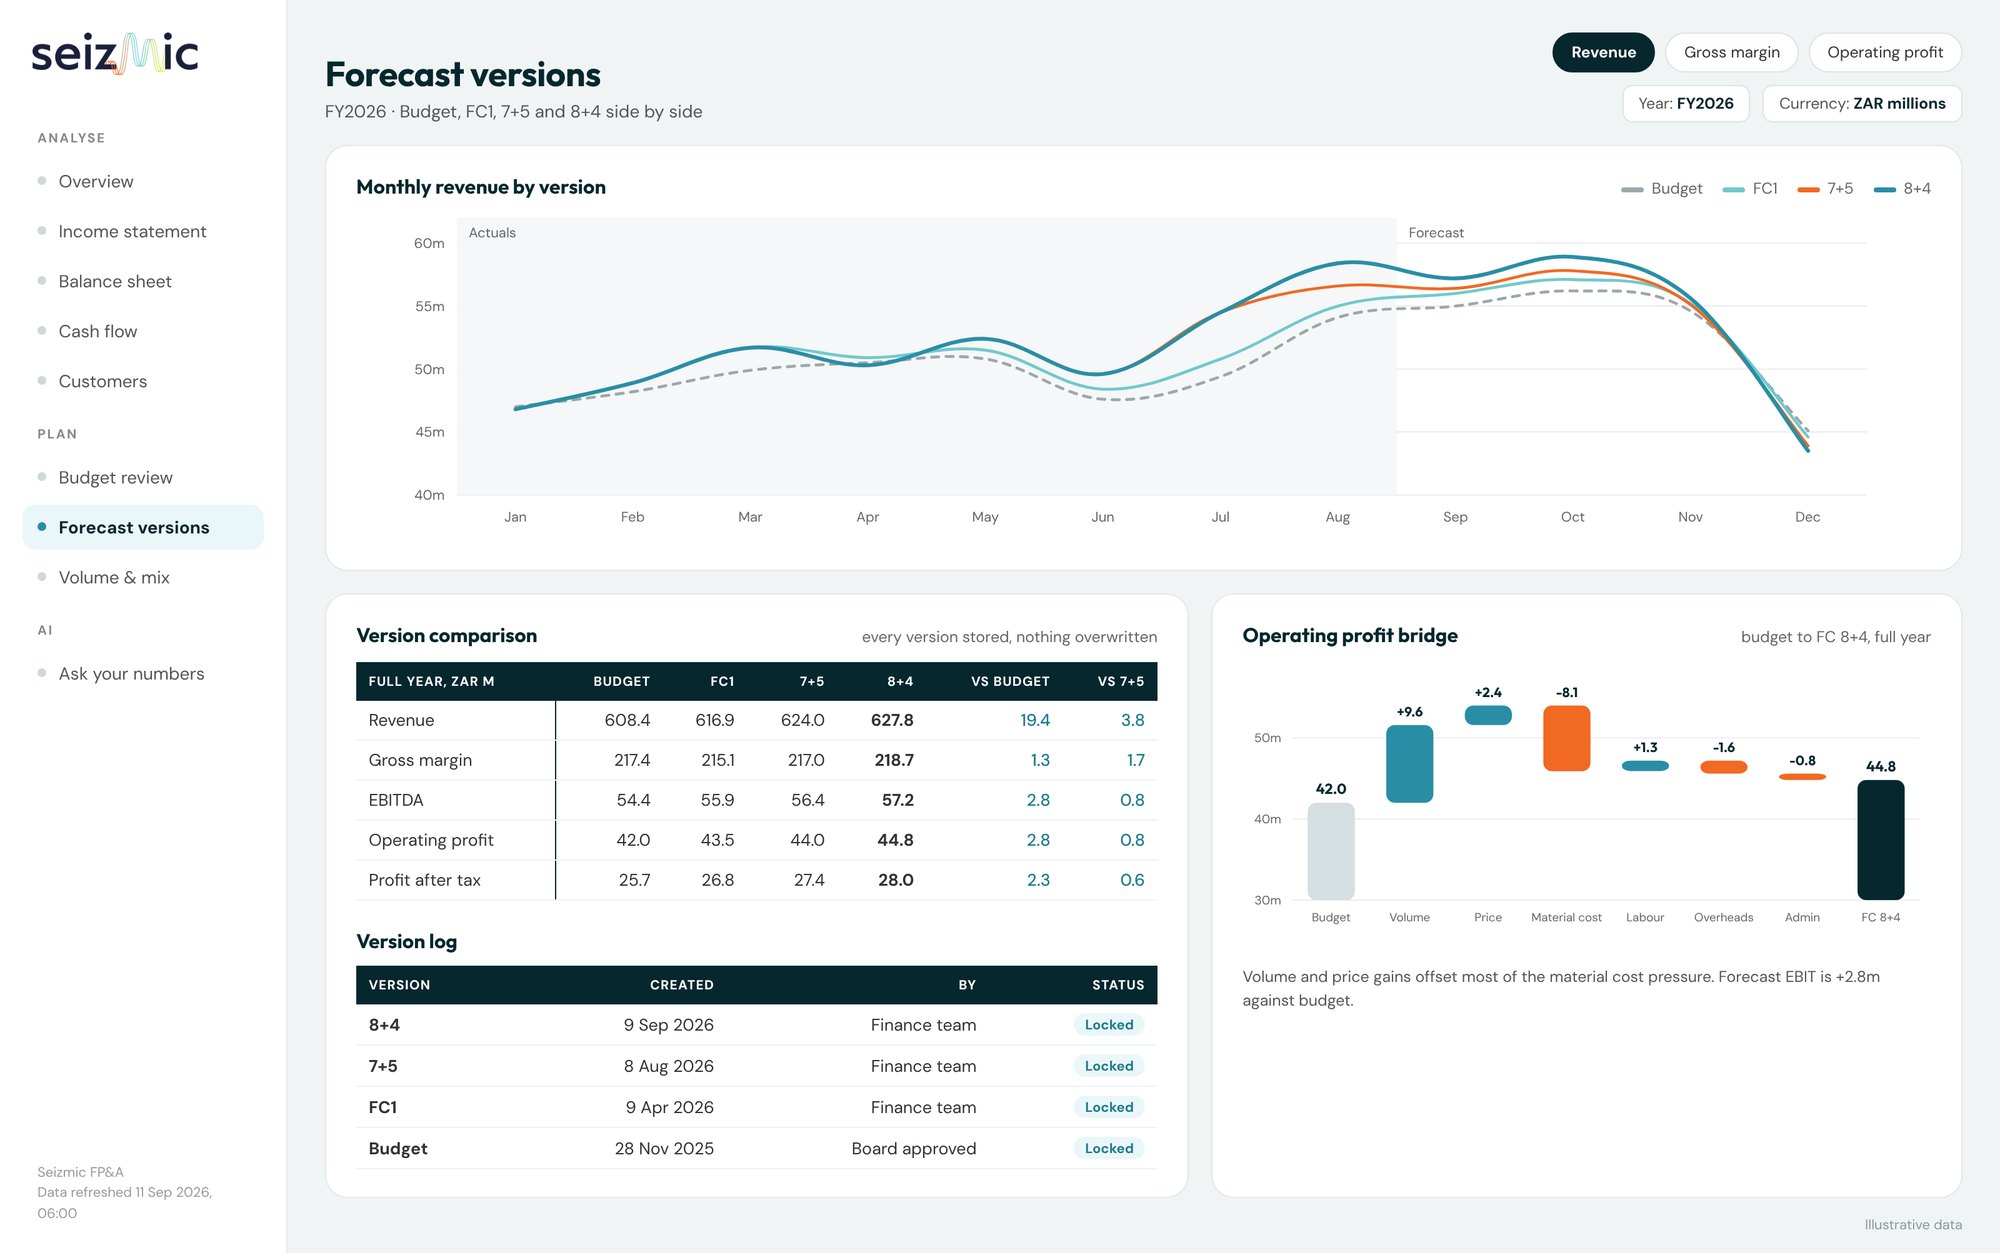
Lock in actuals, update the remaining months and keep every forecast version, side by side.
Rolling versions such as 3+9, 7+5 and 8+4, each stored and locked
Actuals to date loaded daily from your ERP
Full-year comparison of budget and every forecast, with a bridge explaining the movement
Compare actual results with budget, forecast and prior year, then explain the drivers: volume, price, mix, cost and timing. This is the core of month-end commentary.
With Seizmic
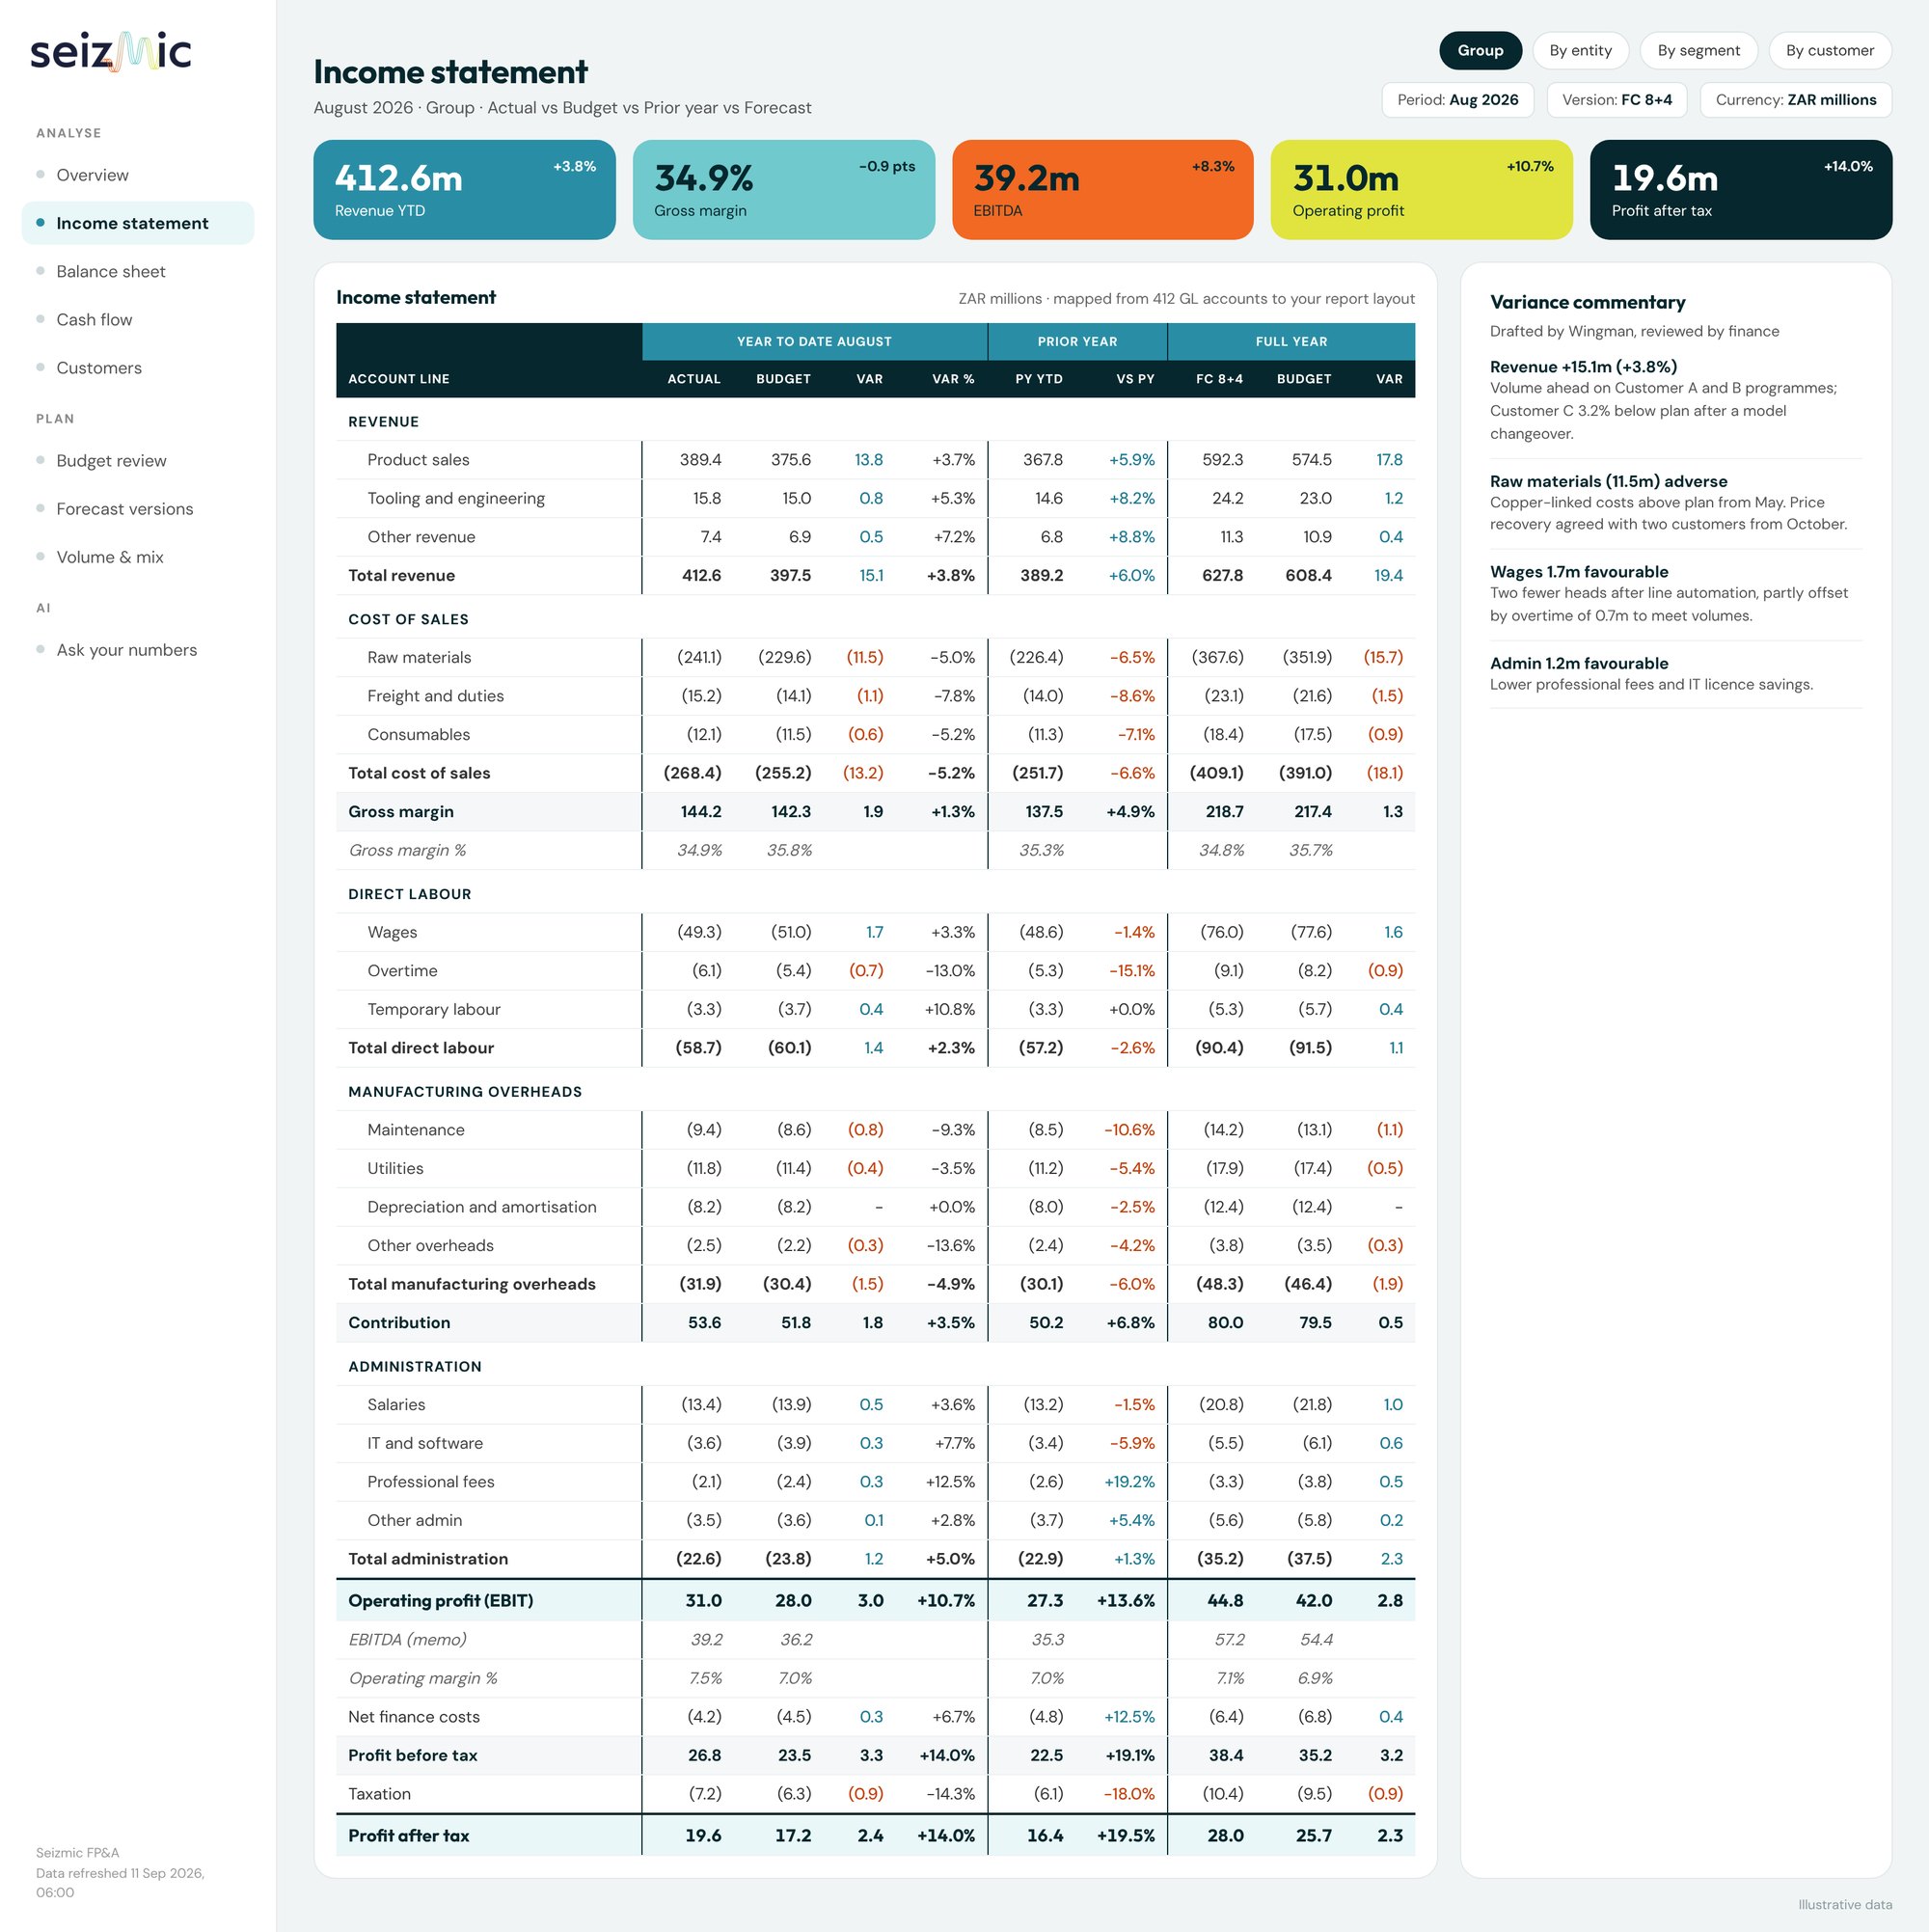
Variances already split into volume, price, mix and rate, with commentary drafted for review.
Actual vs budget vs forecast vs prior year on every statement
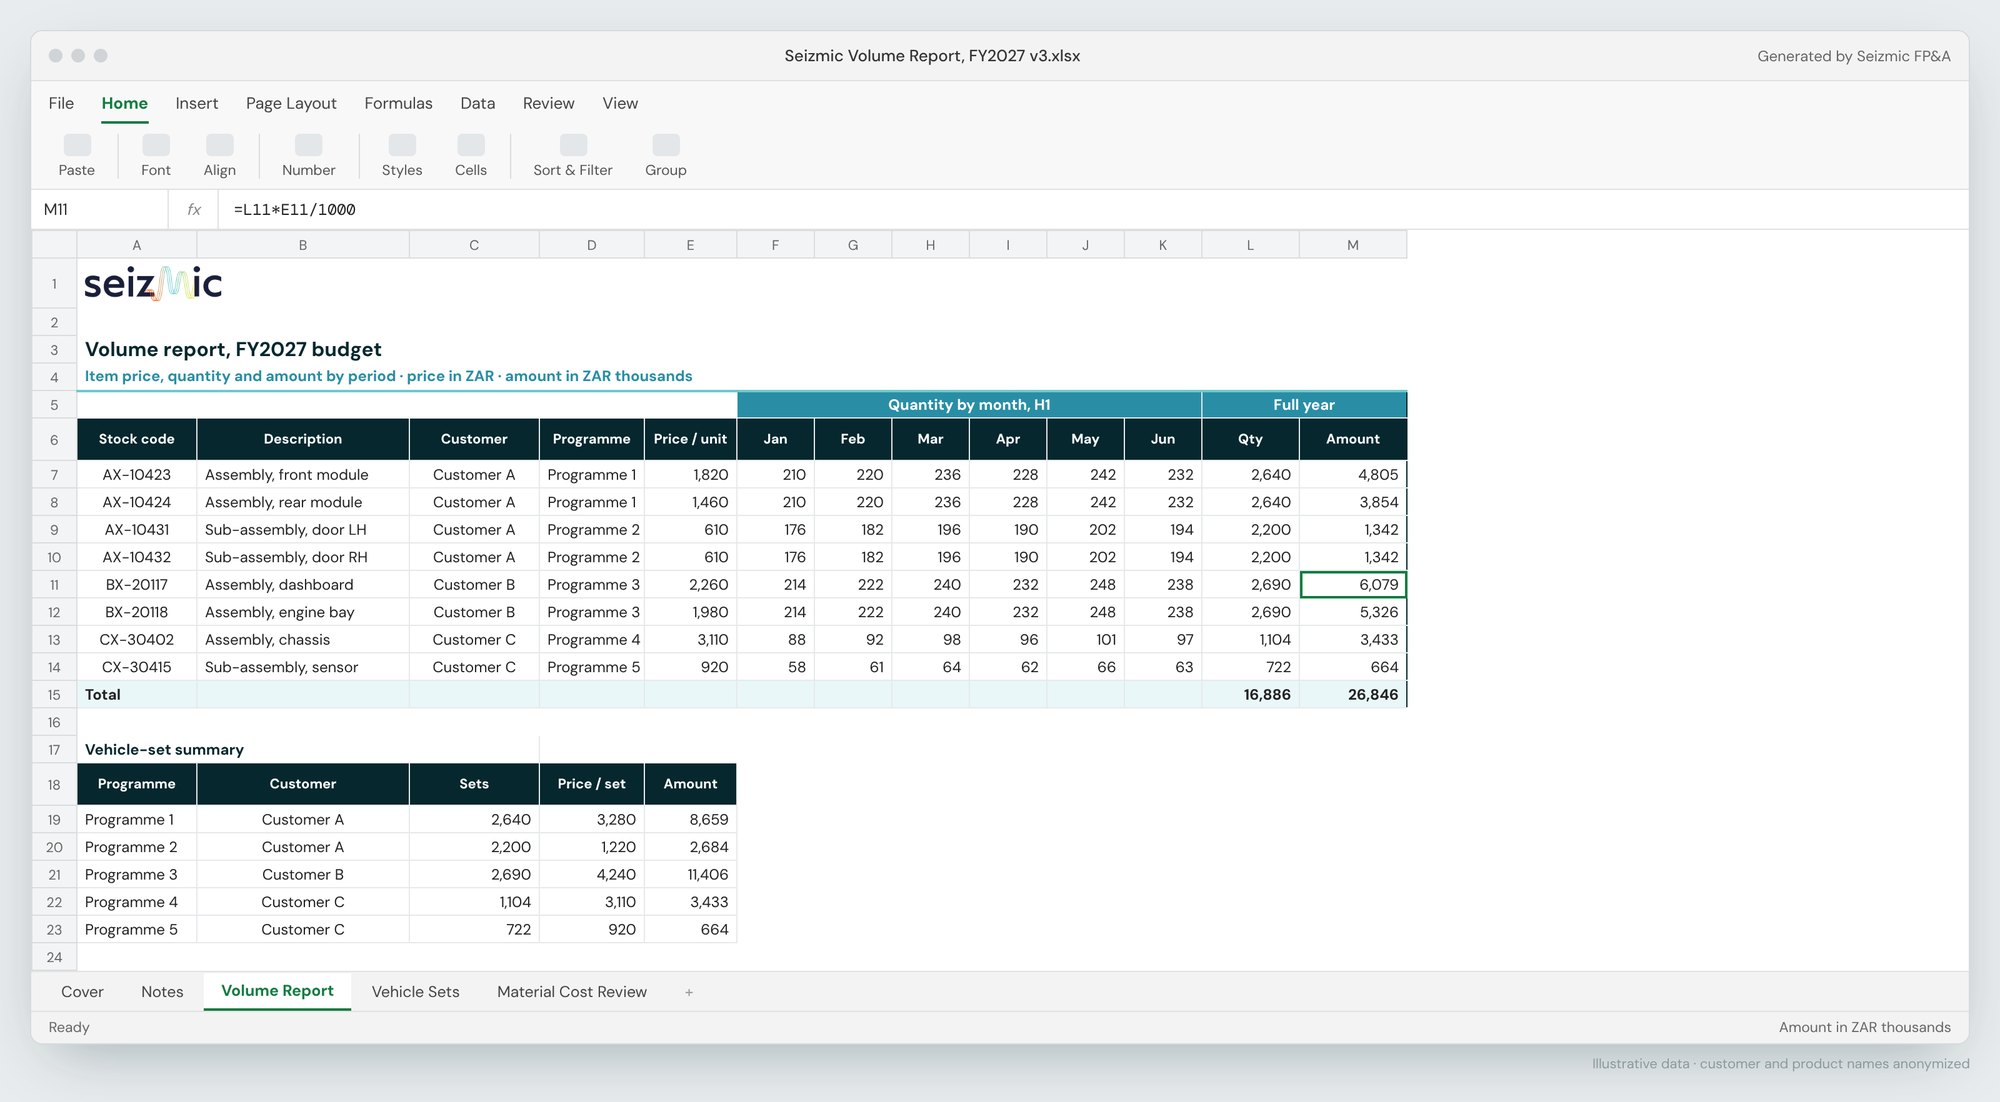
Volume, price and mix by customer and stock code
Drill from any variance to the GL account and transaction
Wingman, Claude or Copilot draft the commentary, with figures traced to the source
Produce month-end packs, board packs and KPI dashboards: income statement, balance sheet and cash flow views by segment, entity or customer.
With Seizmic
Month-end and board packs that build themselves when the ledger closes.
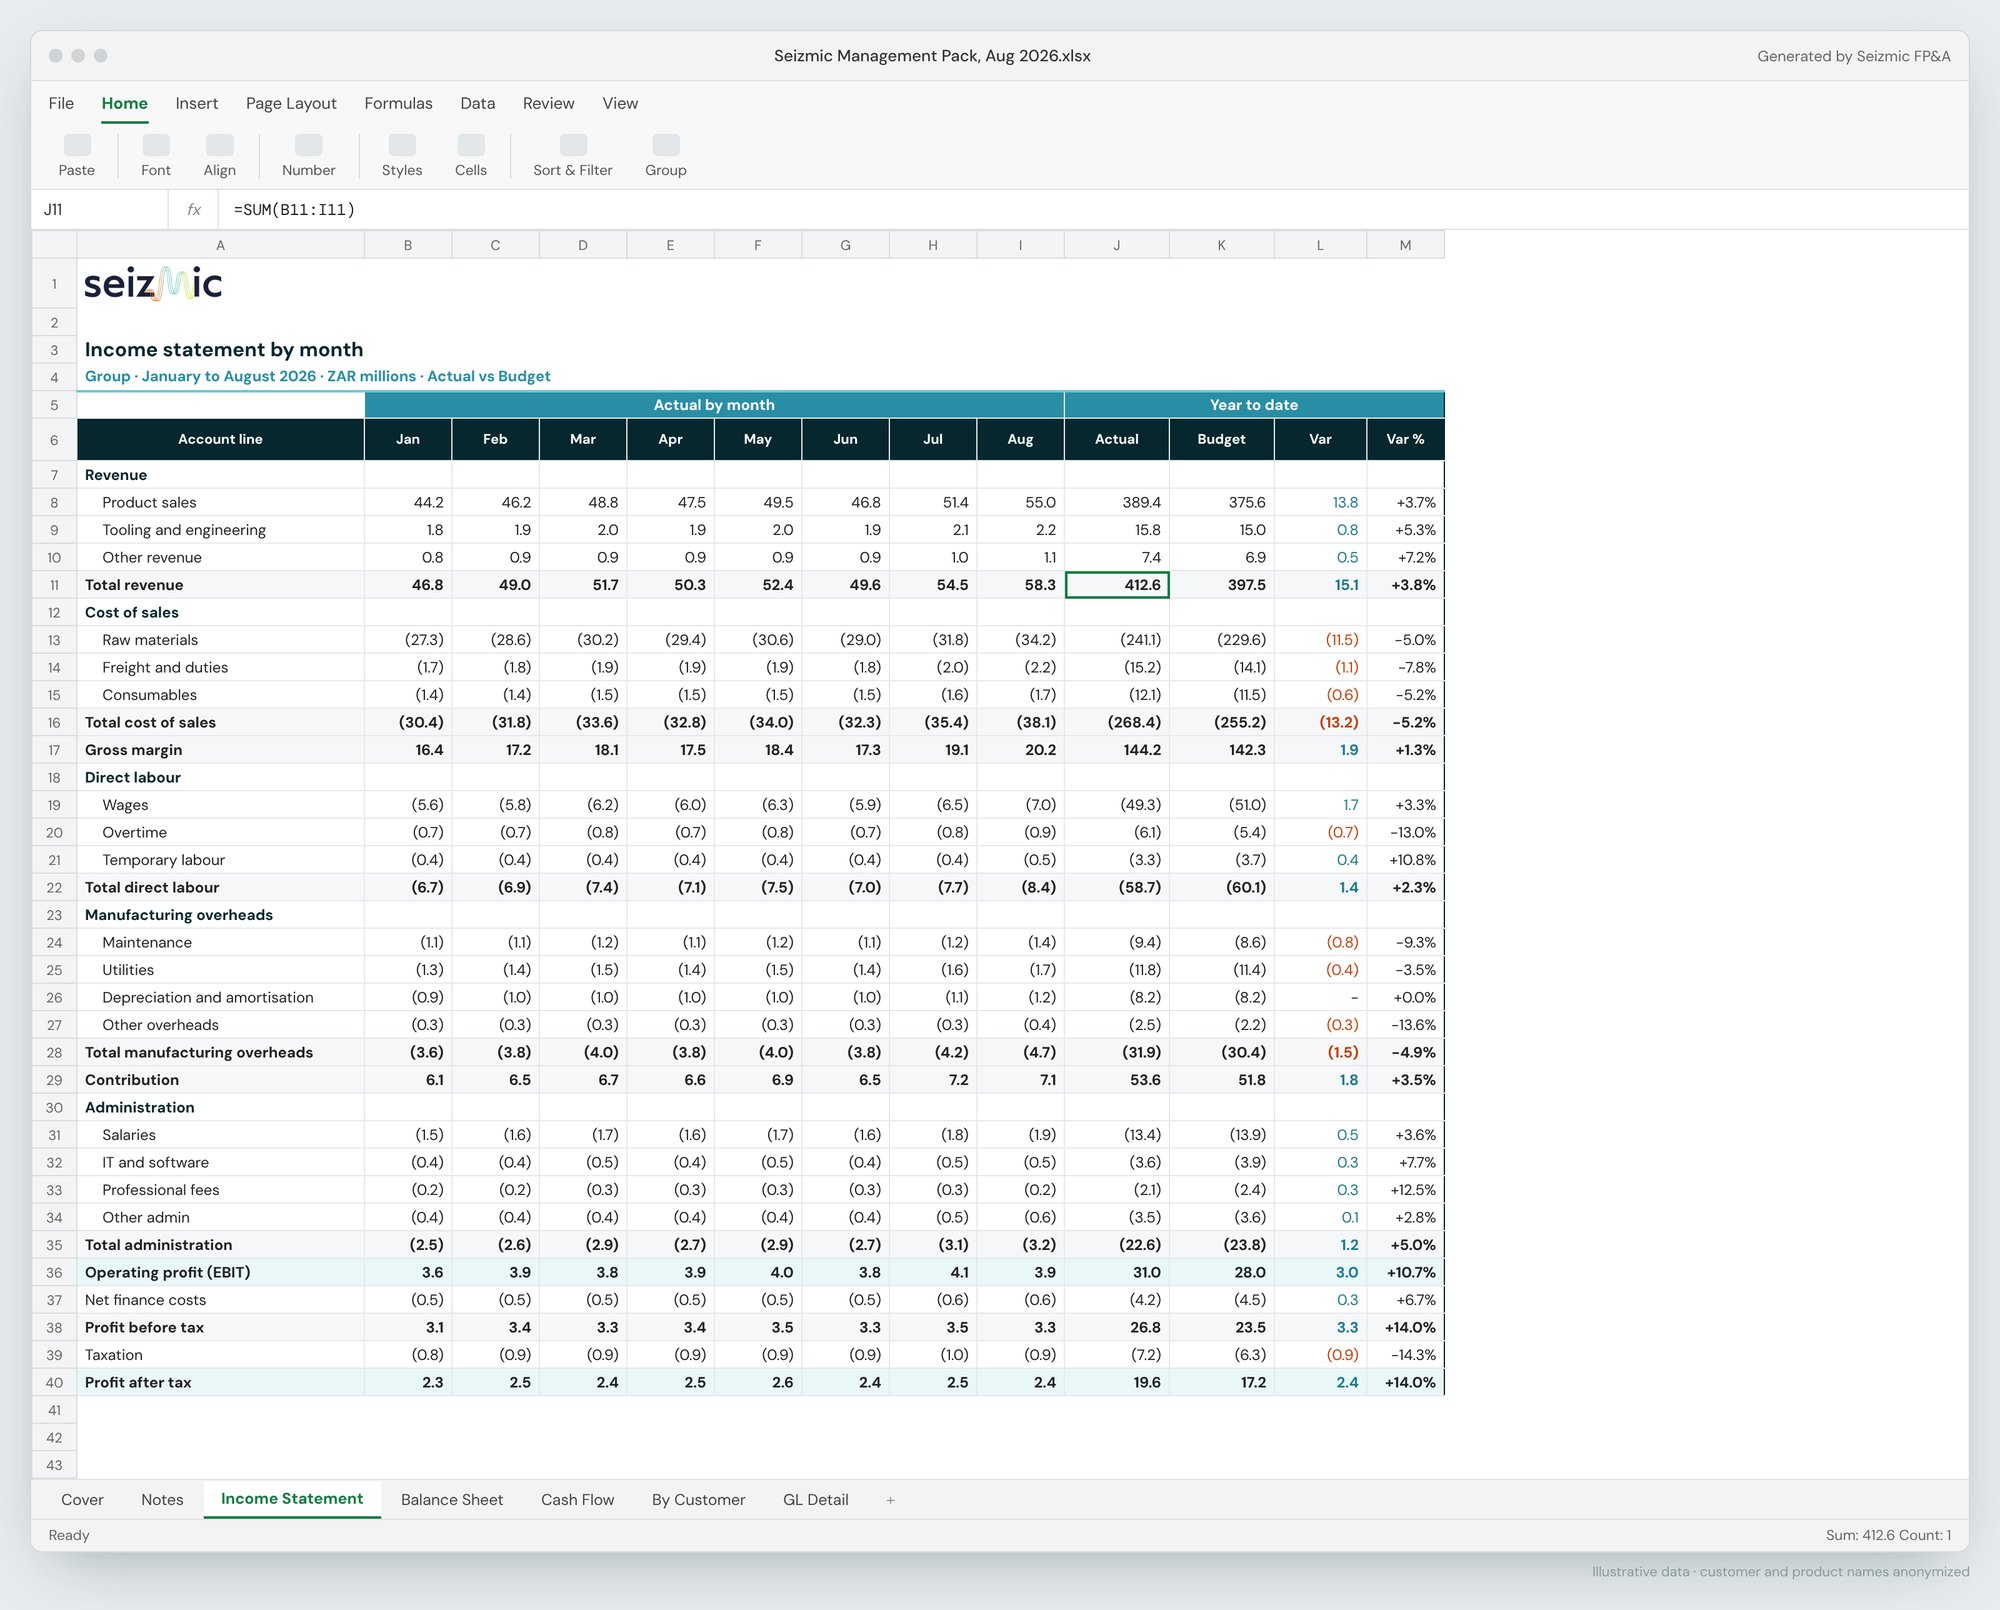
Income statement, balance sheet and cash flow in your own layouts
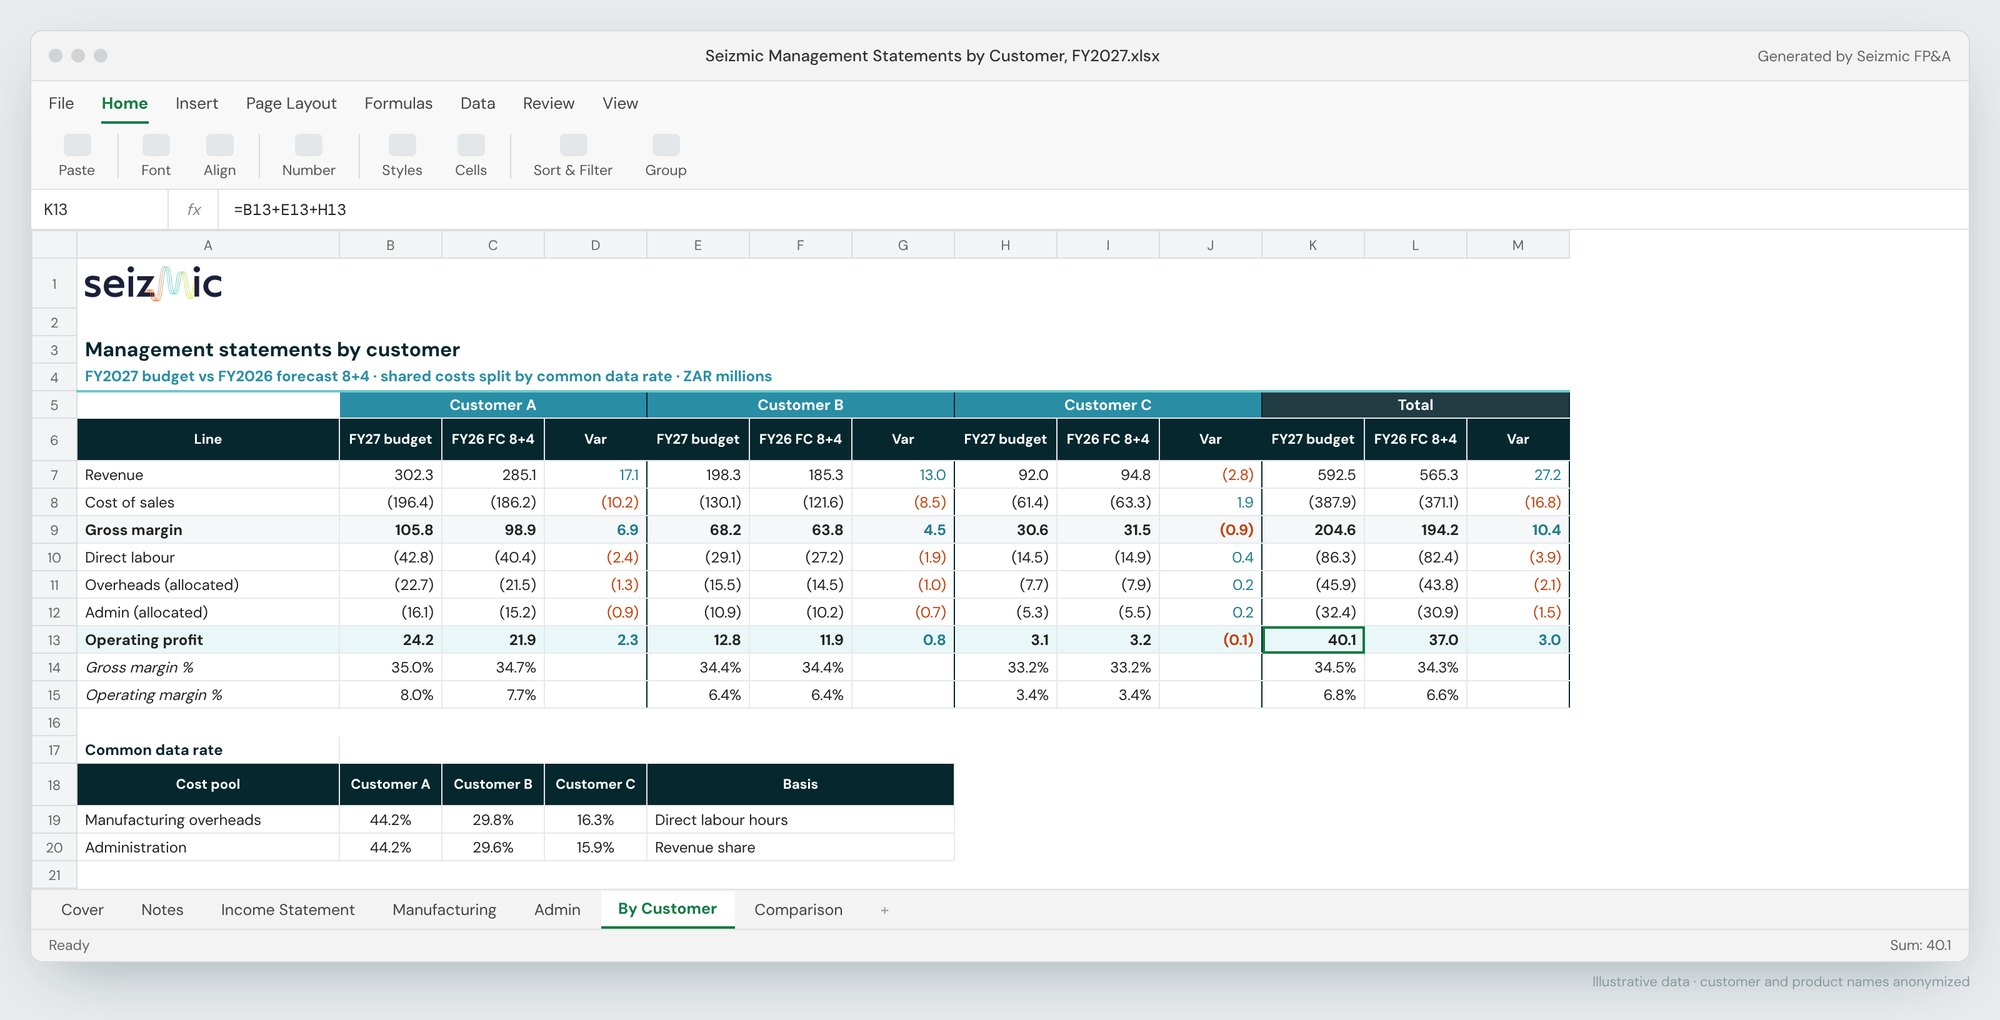
By entity, segment or customer, with shared costs allocated
Board pack in Word, detail in Excel, live dashboards in Power BI
Refreshed daily, so there is no copy and paste
05
Financial modeling and scenario planning
Build driver-based models for "what if" questions, such as an FX move, a lost customer, a new plant or a price increase, plus sensitivity and best and worst cases.
With Seizmic
Ask the question in Claude or Copilot and get the scenario, worked from your governed forecast.
What-if, sensitivity tables, goal seek and best/worst cases in plain language
Calculated from your real cost structure and drivers, with every assumption listed
Scenarios saved as Excel workbooks, then adopted as a forecast version when approved
06
Strategic and long-range planning
Turn company strategy into a three to five year financial plan and check that the targets are achievable.
With Seizmic
Multi-year plans that start from the same model as the budget and the actuals.
Long-range plan built on the current budget and actual run rate
Targets tested against the volume, price and cost drivers needed to reach them
Strategy scenarios compared side by side through Claude or Copilot
[Confirm multi-year plan versions in the product.]
Run business cases, investment appraisals (NPV, IRR, payback), pricing analysis, and product or customer profitability.
With Seizmic
Profitability and business cases built on governed numbers, not exported spreadsheets.
Full income statement for every customer, down to operating profit, with transparent allocation rates
Product and stock code margins against standard and plan
NPV, IRR and payback worked by Claude from Seizmic baselines, with the formulas shown
Pricing analysis from price, volume and material cost per stock code
08
Performance management
Set KPIs and targets, track them, and connect operational metrics (units, vehicle sets, yields) to financial outcomes.
With Seizmic
KPIs and operational drivers tracked in the same model as the money.
KPI dashboards against target, with exceptions flagged every month
Units, vehicle sets, yields and price per unit linked to revenue and margin
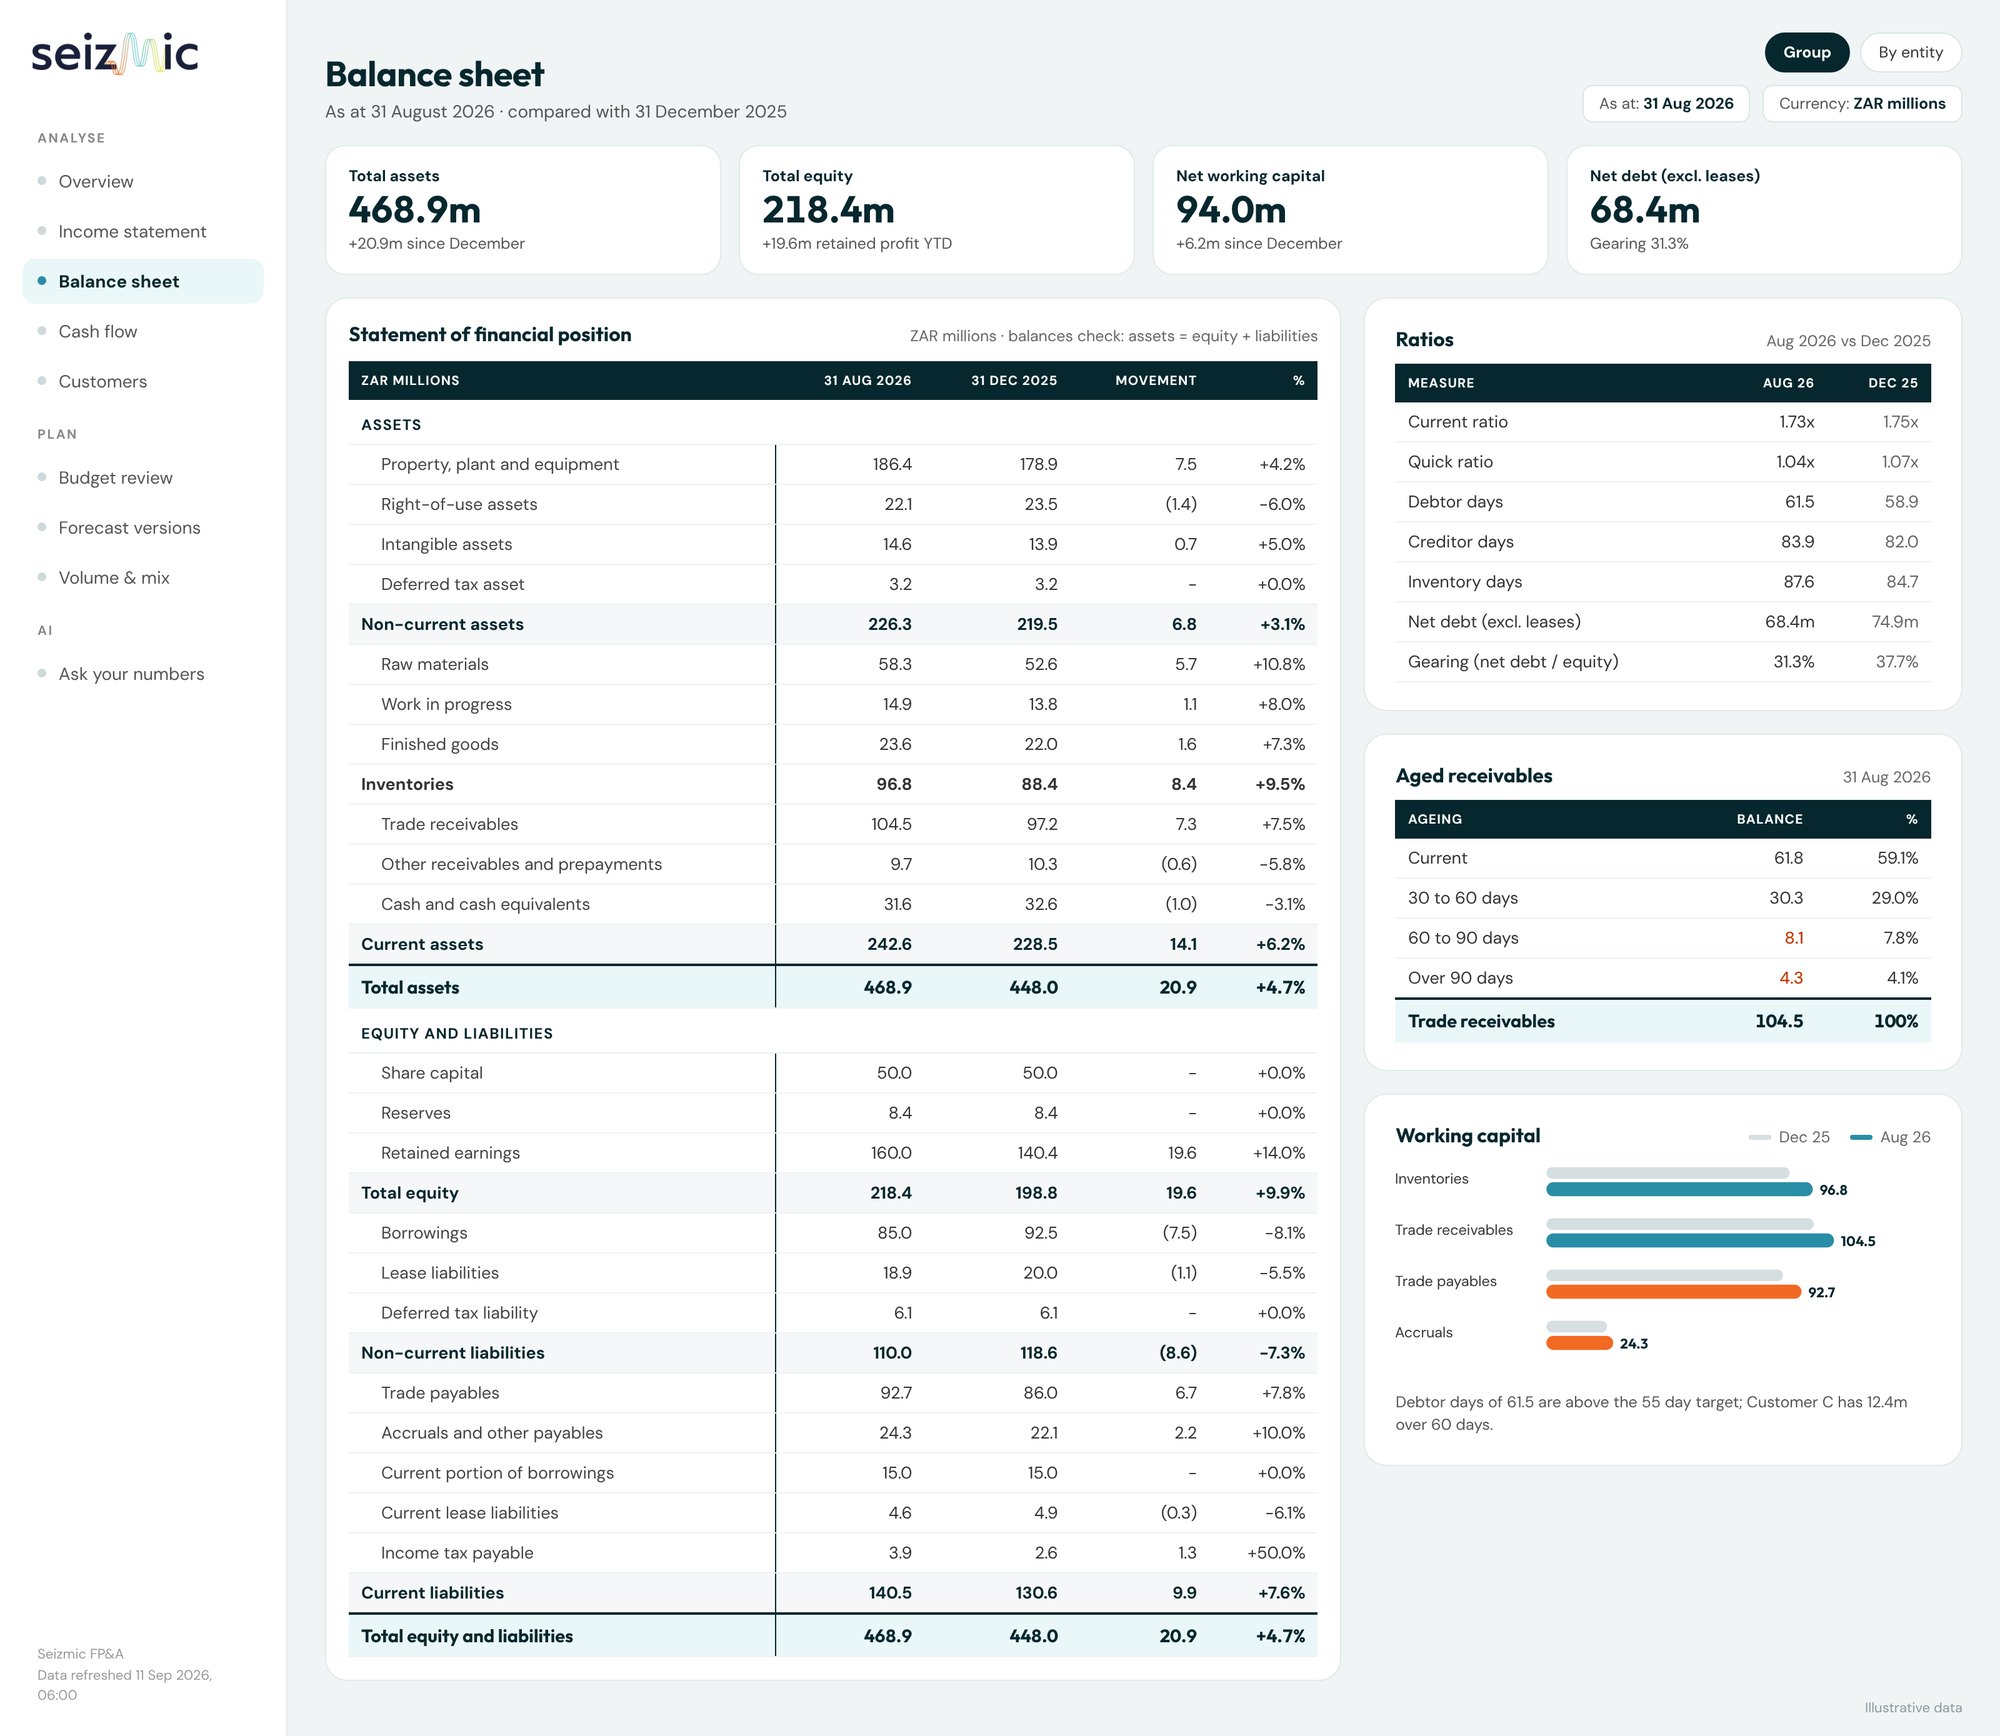
Ratios such as gross margin, EBITDA margin, gearing and debtor days worked out for you
09
Cash flow and working capital planning
Project liquidity, funding needs and debtor and creditor cycles, often together with treasury.
With Seizmic
A cash view that always ties to the income statement and balance sheet.
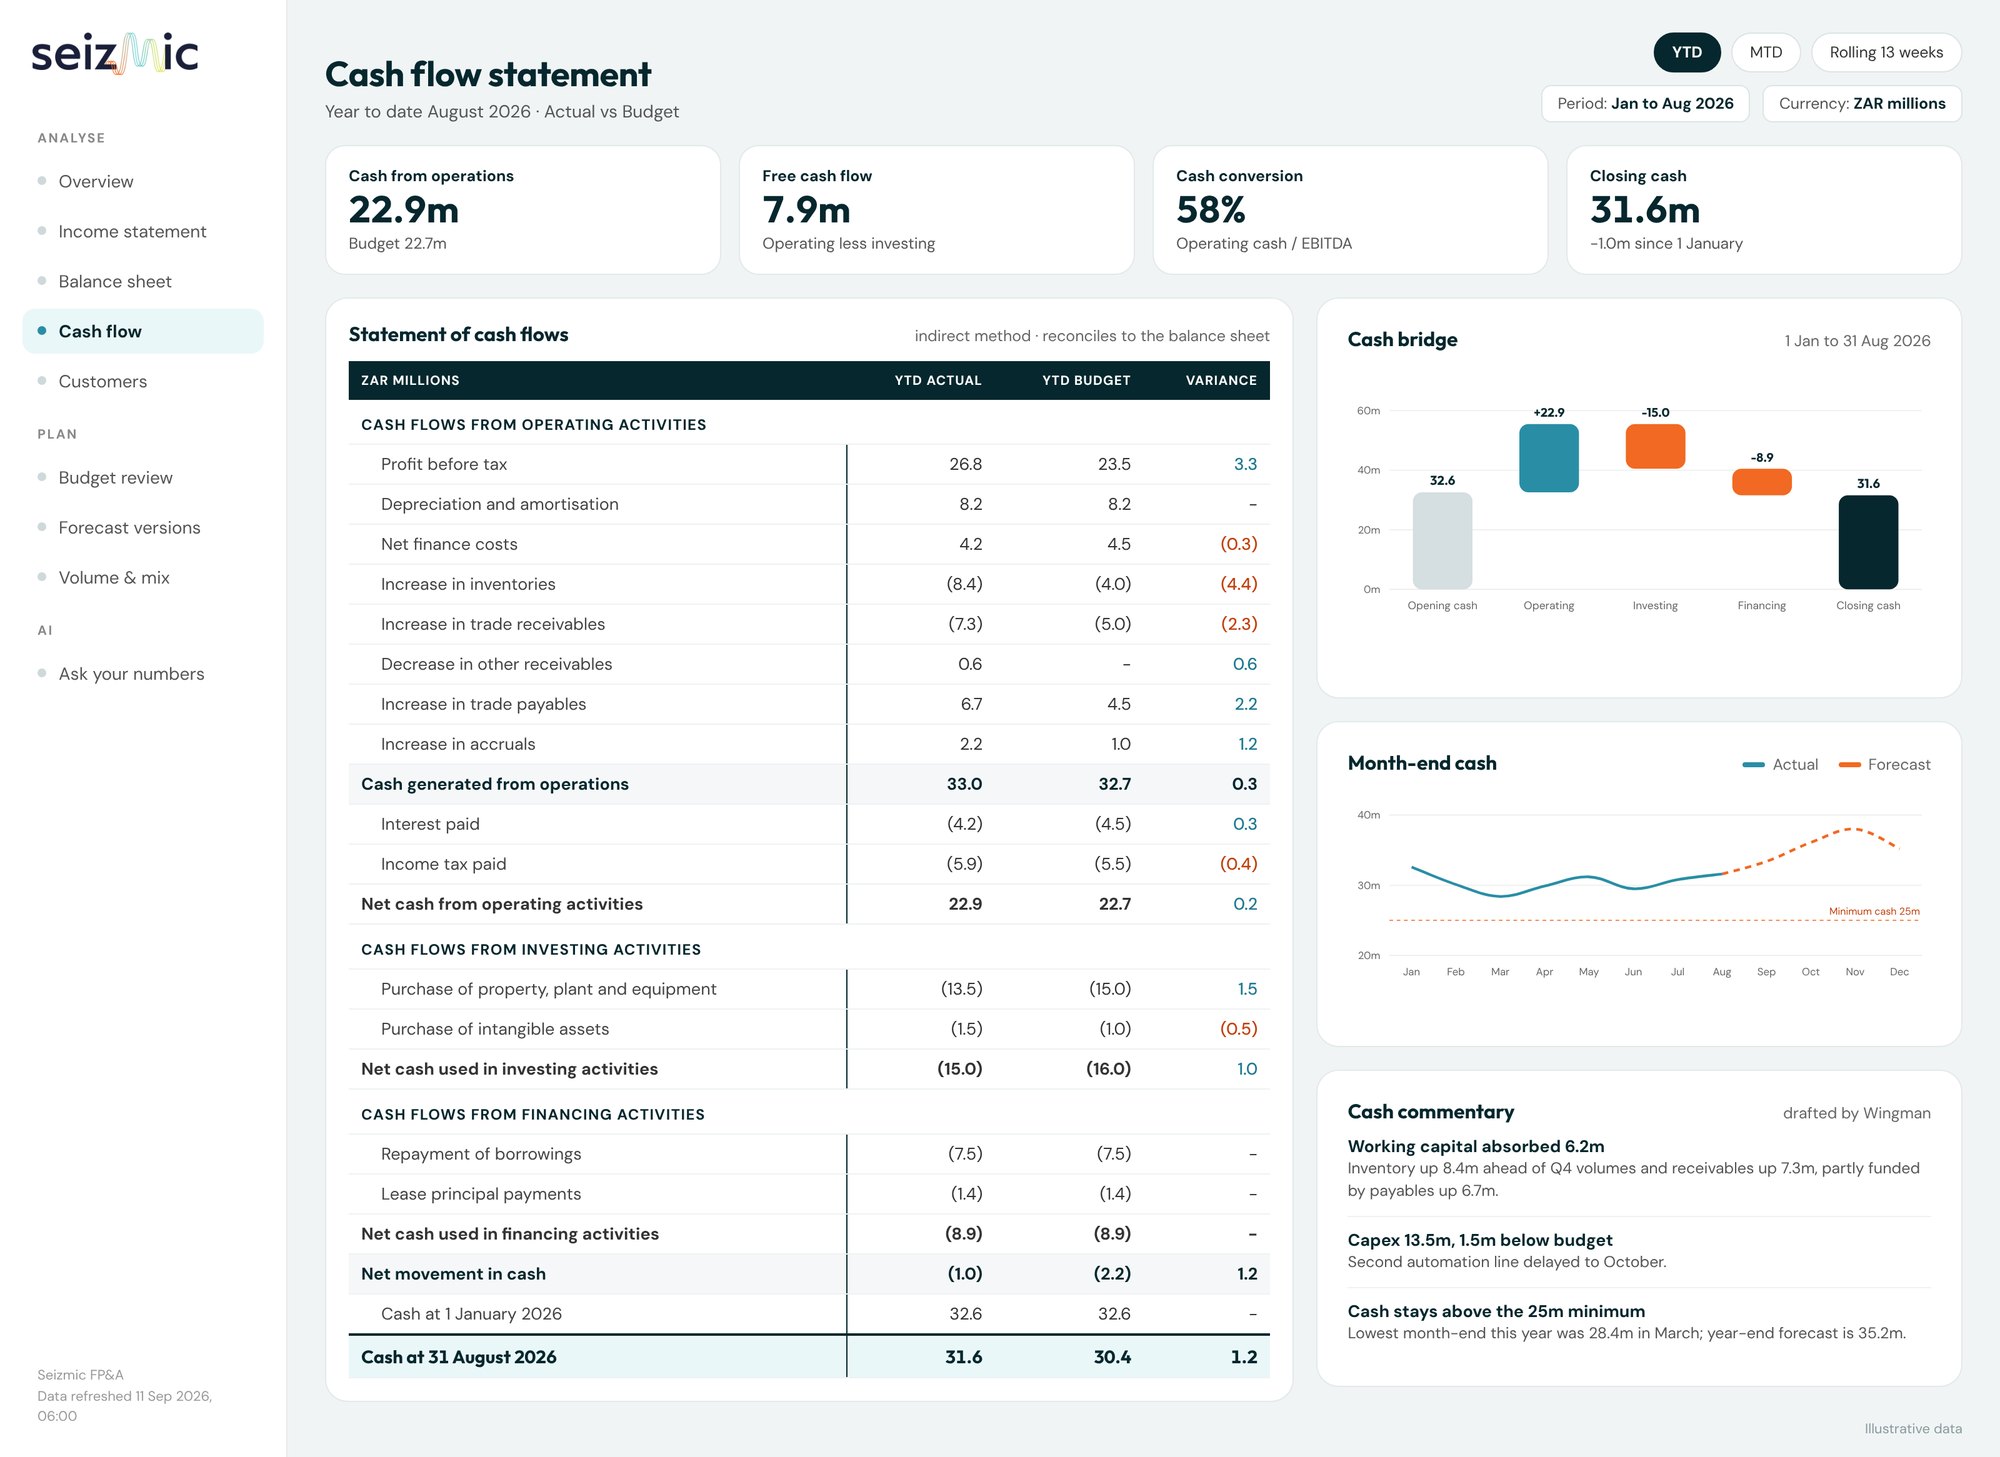
Indirect-method cash flow built from statement movements, so it reconciles
Cash bridge and month-end cash forecast with minimum cash threshold tracking
Debtor, creditor and inventory days, with aged receivables
Work with operations, sales and executives to challenge assumptions and turn numbers into actions.
With Seizmic
Less time assembling numbers, more time in the conversation.
Managers and executives get answers in Teams or Claude without waiting for an analyst
Budget owners see their own lines, comments and ratings
Follow-up questions for each owner drafted from weak commentary and large variances